VZO
The VZO is a volume-based oscillator that creates overbought and oversold readings based on price action and volume.
You can look for divergences, extremes and retests/rejections of the zero-line to predict the future more accurately.
Overbought and Oversold Zones
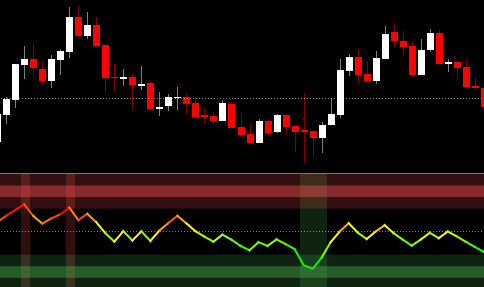
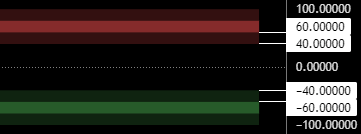
The overbought and oversold zones start at +/-40 (transparent green/red bar).
The area for strong overbought and oversold conditions is at +/-60 (darker green/red bar).
If you enable "Highlight Extremes" the background color will be changed as soon as the +/-40 threshold is crossed.
Zero Line
The zero line is an important level for the VZO as it often acts as support/resistance. Some traders also like to trade crosses above/below the zero-line as they often mark a sentiment shift.
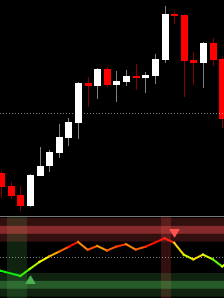
Reversal Risk Arrows
The Reversal Risk Arrows are plotted when the oscillator is overbought or oversold and at risk of reversing. They are more like a "be careful" or "attention required" signal.
Moving Average
You can enable a customizable moving average to make better informed decisions.
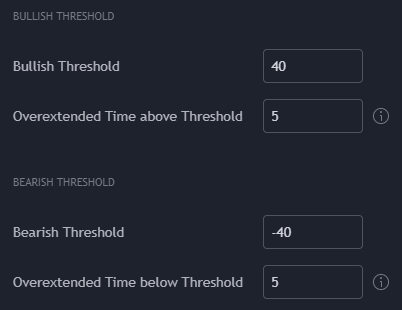
Threshold System
The threshold system allows you to get alerted whenever the VZO has been above/below a certain threshold for a custom amount of candles.